.svg)


When running an A/B test, you can't just look at the difference in conversion rate after a couple of weeks and conclude that one version is better than the other. Instead, you need to do a statistical significance calculation, which tells you mathematically whether this observed result is likely to be true, or just the result of random noise.
If you don't have much traffic and/or aren't observing a big difference between the two versions, it's highly likely that the test isn't yet statistically significant.
Luckily we don't need to get into the statistics much ourselves: hundreds of free A/B test calculation tools are available online. We just need to plug in the numbers, and it'll tell us if the test result is significant.
What is statistical significance?
Statistical significance is different from significance. So while a result might look or seem significant, it’s crucial to objectively determine its significance using mathematical methods.
Otherwise, we leave ourselves open to various biases. A result might look significant on the face of it, but when you take an objective measure, you might determine it’s too hard to delineate from coincidence or random noise. As we know, making decisions without objective evaluations can be painful in marketing and other walks of life!
In simple terms, statistical significance identifies whether results are “real.” If the results are statistically significant, they’re unlikely to be caused by random factors. Note the word ‘unlikely’ - it’s extremely difficult to totally rule out chance unless you’re collecting multiple datasets or have very large sample sizes.
Statistical significance is used in all disciplines of science, marketing, advertising, sports, business, finance, and anything else that involves quantitative analysis.
In this context, we’re discussing statistical significance in the context of A/B testing. A/B testing seeks to uncover differences between a control group (A) and an experiment/treatment/test group (B). It’s the simplest form of randomized experiment. A act as the null hypothesis, and B acts as the alternative hypothesis.
How to test statistical significance
It’s firstly necessary to have the ability to measure two similar samples. This is where sample size and sampling methods come into play. For example, if you A/B test two pages, but one is designed to appeal to women, and one is designed to appeal to men, you won’t be able to meaningfully compare the two. Each sample should be drawn from the same population.
Sample size
Then, it’s necessary to calculate the required sample size. The goal here is to provide a simple way to calculate the required population size for a test to be statistically significant.
In other words, this determines the required number of individuals you need to assess that an increase/decrease of x% can be trusted with a 95% confidence level. If you want to detect smaller changes, you need a bigger population size. This is also called pre-test analysis.
- For example, say your baseline conversion rate is 10%.
- You want to detect an uplift of 20% for your B variant. You’re setting statistical significance at 95%, which is the standard convention for most applications. The statistical power is also set at a conventional 80%.
- In this scenario, you’ll need 3,622 individuals per sample. So if you have 1000 visitors per day, it’ll take around 7 days to collect the required data.
- Say if you want to decrease the minimum detectable effect to just 5%. In this case, you’ll need a sample size of around 56,885 per variant.
- It’s essential to answer the question “how many samples do I need for an A/B test” before you conduct the test and run a statistical significance check on the results.
- You can do this differently by inputting your expected number of samples per variant, number of samples per control, and your expected uplift. You can then compare this against your actual result to see if your results are statistically significant for the sample size.
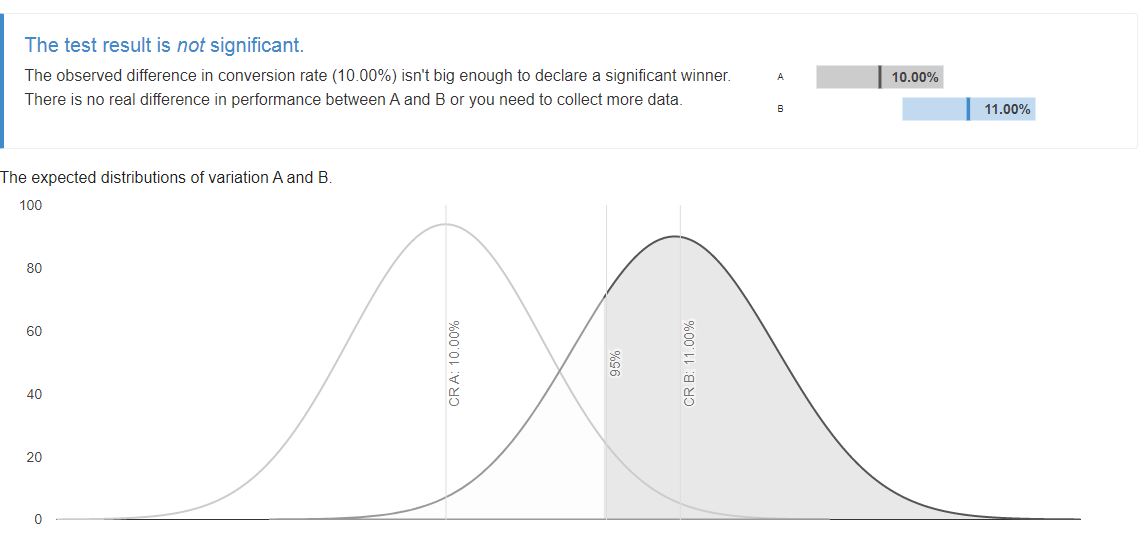
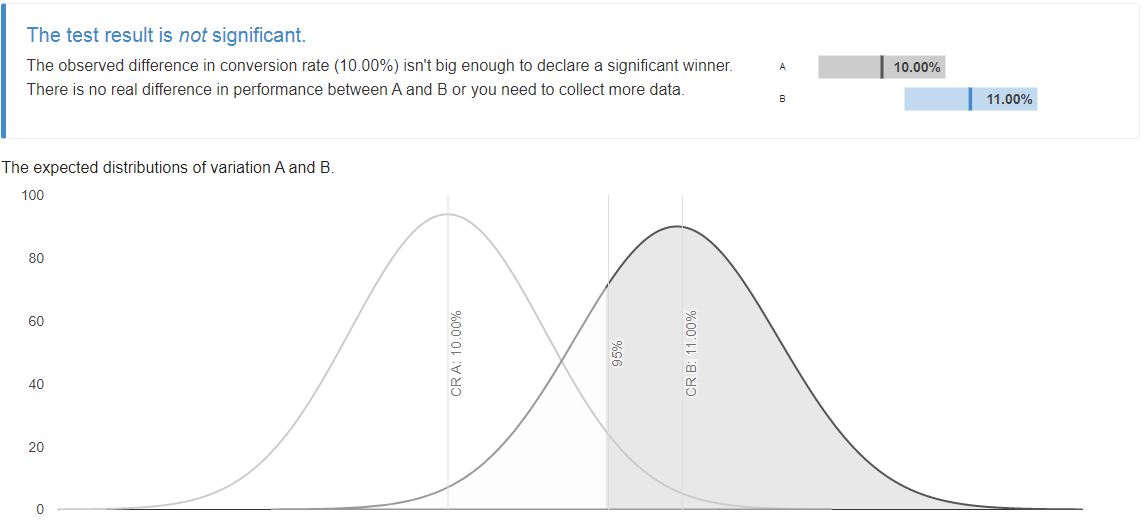
Below we can see the result for 5000 unique visitors per variant with an expected conversion rate of 500 for the control. We want to find out if we can detect a 10% uplift. The result shows that the difference in conversion rate isn’t big enough to declare statistical significance.
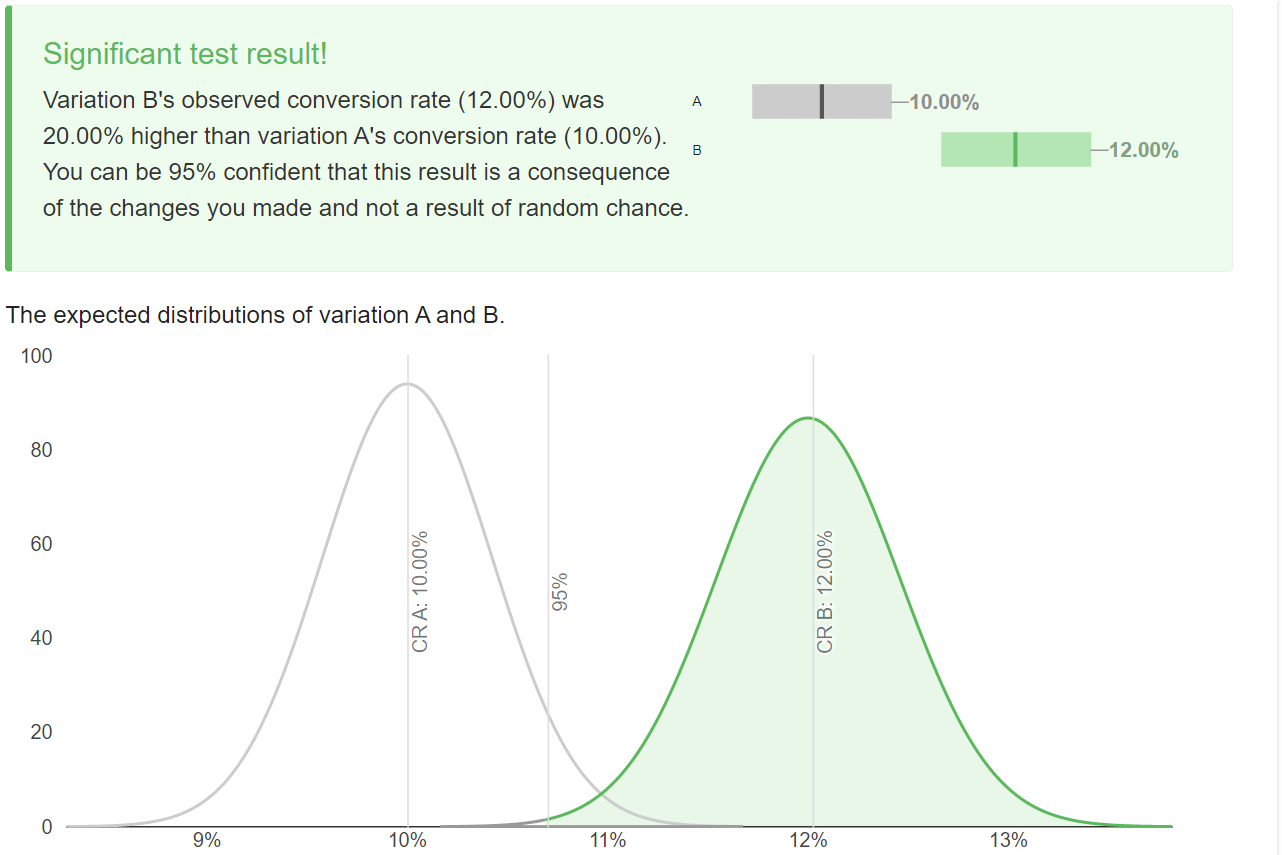
However, if we want to detect a larger uplift of 20%, then that’s achievable using these figures. A 20% uplift here takes up from our baseline conversion rate of 500 to 600 - a 20% uplift. See below.
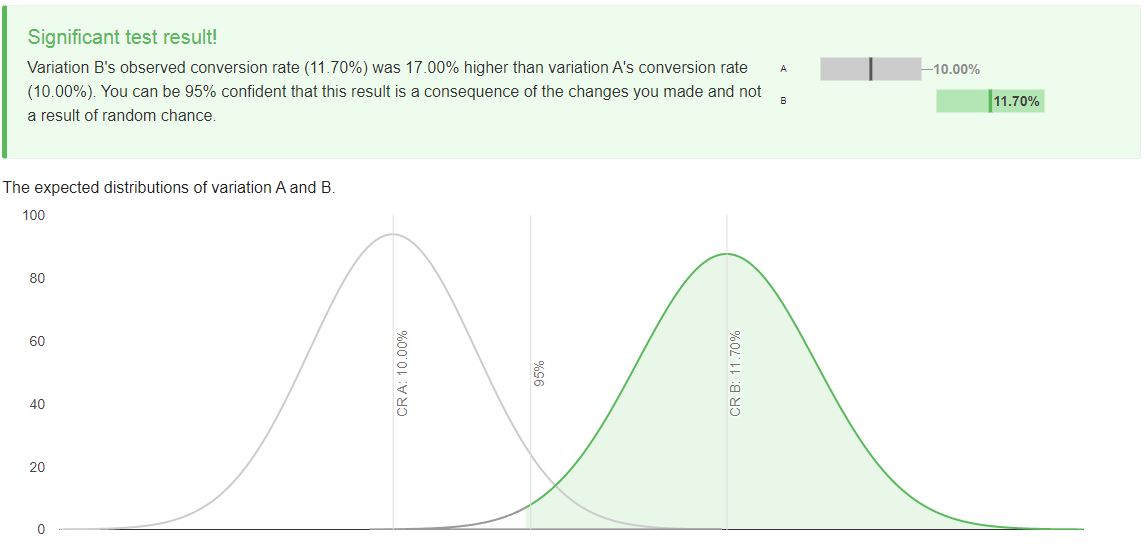
After we go away and collect results, we come back and we realize we’ve actually only made 585 conversions - slightly below our target.
We plug those numbers in and variation B's observed conversion rate (11.70%) is 17.00% higher than variation A's conversion rate (10.00%), which still means we can be 95% confident that this result is a consequence of deliberate changes and not a result of random chance.
We cannot determine statistical significance if we have just 550 conversions (10%). So to detect a statistically 10% uplift, we’ll need to collect more samples.
P-Values, significance levels and confidence levels
These concepts are related but often misconstrued (especially in the case of significance levels and confidence levels). So let’s take a closer look:
What is the p-value?
The p-value is the likelihood of observing evidence supporting a strong or stronger difference in performance between variations and baselines. P-values do not indicate how large or small the effect size is or how important the result might be. Generally, in most studies, p-values of 0.05 or less are considered statistically significant, but the threshold may be set higher.
P-values are related to the significance level (alpha). The term significance level refers to a preset probability, and the term P-value is used to indicate a probability calculated after the study is concluded.
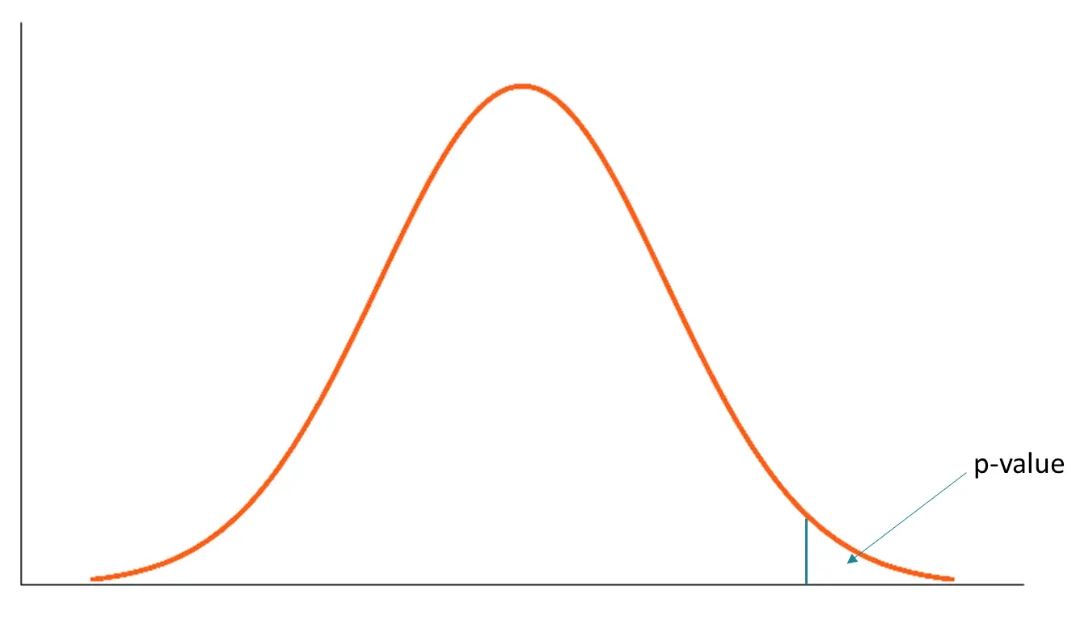
Broadly speaking, a p-value greater than 0.05 means that deviation from the null hypothesis is not statistically significant, and the null hypothesis should not be rejected.
There is some debate surrounding this, and many researchers believe the p-value is misinterpreted - results do not become ‘true’ on one side of the line and ‘false’ on the other, as is often assumed. For the most part, however, p-values exceeding 0.05 mean that the observed effect is highly likely not to be significant.
Significance level and confidence level
These two concepts are different, despite sounding similar. In fact, they’re often mixed up entirely. Confidence interval is also often thrown into the mix and is defined as the upper and lower bounds of the estimate you expect to discover at the given confidence level.
Broadly, the significance level defines the distance that the sample mean needs to be from the null hypothesis to be determined as statistically significant. For example, setting a significance level of 0.05 indicates a 5% risk of concluding significance where there isn’t significance (a false positive or type i error).
The confidence level, however, defines the distance for how close the confidence limits are to sample mean. Confidence levels determine the probability that, if the test were repeated over and over, the results obtained would be the same.
Lower significance levels indicate that you need stronger evidence before rejecting the null hypothesis. 0.05 (95%) is the convention, but in some scenarios, this might be as high as 99% in some scenarios.
Factors that affect statistical significance
Statistical significance is more complicated than most calculators tend to encapsulate, but once you’ve got a firm grasp of what sample size you need to produce statistically significant comparisons, it gets much easier.
It’s worth mentioning that most rules surrounding statistical significance are conventions. For example, calculating the required sample size is great - but what if you’re a B2B business that makes a very small volume of very high-value products?
In that case, running A/B tests relies on a good deal of subjective analysis beyond what conventions can provide. It’s not that the rules are made to be broken - far from it - but not all tests will slot neatly into the box.
There are two fundamental factors that affect every statistical significance calculation:
Sample size
Sample size refers simply to the size of the experiment. Some studies require massive samples at the population level (e.g., in public health). In this case, random samples are drawn from the population and analyzed in various ways. If you’re pulling data from population-scale data ranging into the millions, you can detect very small changes.

But realistically, most businesses don’t have access to that data. Instead, they’re working with figures in the thousands. As mentioned, it depends on the product side as well. While an eCommerce business selling thousands of cheap products might have a ton of data, a B2B business making equivalent revenue might just have a handful of sales.
Even so, when it comes to objective statistical significance, larger sample sizes mean that you can detect smaller differences more reliably. This further highlights the importance of clean, accurate data, feature engineering, feature selection, and other practices that enhance data dimensionality while keeping sample sizes workable.
Effect size
Effect size is essentially what we’re measuring, but this depends on the sample size. For example, if you have 100 visitors and make 10 conversions at baseline and your variant boosts this to 20, the effect size in isolation of the same size is large - your conversions doubled from 10% to 20%.
However, ruling out randomness in small sizes is not so simple, thus casting the effect size into doubt for such a small sample. If you can’t collect enough data for your A/B test, you can run lots of different A/B tests and analyze the results together or just collect data over a very long period of time.
The effect of demographics
As is often the case in statistics, plenty of snakes are hiding in the grass. Everything from missing variables to demographic differences in samples can cast doubt on results.
For example, if you’re A/B testing two variants and one receives random traffic that is heavily biased to one demographic, then how can you compare that against a variant that receives relatively balanced traffic?
If you’re comparing results from surveys and you find missing results that are missing not at random (MNAR), then you might make invalid comparisons that generate biased results.
Increasing sample size has the additional benefit of increasing the likelihood that your data genuinely represent the population.
It’s often said that marketing mix modeling (MMM) is a combination of subjective analysis and interpretation and objective quantitative analysis. Of course, quantitative analysis drives and informs opinion, but at the same time, the data used is intrinsically nuanced and should be treated as a living, breathing entity.
The benefits of statistical significance
Statistical significance calculations are required to determine whether a measurement is objectively sufficient to fulfil a set criteria or threshold of significance. In many cases, statistical significance answers the question “are the results worthy of importance” or in other words “are the results real or the result of distortion and randomness”.
- Suppose you give two groups of people different running shows. Group A receives state-of-the-art running shoes and group B receives normal running shoes. There are some 30 randomly sampled individuals in each group with no immediately obvious sampling bias.
- After each group runs for 30 minutes every day for a month, you have 30 average speed readings for each group. For example, group A’s average speed is 5km/h, whereas group B’s average speed is 4km/h.
- Basic intuition tells us that group A’s improved speed is probably a result of the running shoes.
- But that isn’t enough for science and quantitative analysis - we really need to know how significant this increase is by calculating it for the given sample size.
- In this hypothetical scenario, the increase is certainly significant enough to warrant a larger controlled study.
It’s the same in marketing and business applications. When you compare two groups and find differing results, you need to discover whether that difference is statistically significant, given the sample size. Only then can you action appropriate decisions based on your A/B test results.
The disadvantages of statistical significance
Statistical significance is proposed as an absolute binary measure.
On one side, the results are often declared insignificant (e.g., the p-value exceeds the set limit of 0.5 or the test falls under 95% significance levels).
On the other hand, results are often declared significant (e.g., the p-value is lower than the set limit of 0.5 or the test falls above 95% significance levels).
In reality, there is a good deal of grey area between the two poles. For example, in some studies, p-values exceeding the alpha significance level are still significant depending on other aspects of the study.
For the most part, though, setting your significance level at the conventional 95% and plugging your numbers in will suffice.
Summary: Statistical significance calculator
Calculating statistical significance is relatively simple and gives weight and credence to the results of A/B tests.
There are many calculators available online, but it’s important to remember that sampling has a massive effect on your results.
The more data, the better, so long as it’s workable. For those with lower volume or conversion rates, this means running longer A/B tests to collect larger sample sizes. Of course, running reasonably long tests is a good idea anyway, as it irons out transient fluctuations.
